In 1952, Shpol’skii and co-workers reported fluorescence and phosphorescence spectra of various aromatic hydrocarbons in shock-frozen n-alkane solutions at 77K with remarkably narrow bands. Since then this so-called Shpol’skii-effect has been used extensively in spectroscopy to enhance the resolution of vibronic spectra.
We have applied single-molecule methods to investigate the structure of the n-alkane matrices on a (sub)micrometer scale, and in particular the relation between orientational ordering, frequency and linewidth. A comparative study was performed on 2.3, 8.9-dibenzanthanthrene (DBATT) in n-decane, n-undecane and n-tetradecane. Distinct incorporations of the DBATT molecules were recognized and the n-alkane matrices reveal weak structural ordering. The order does not increase, nor does the ensemble optical linewidth decrease going from bulk to sub-volumes of less than 1 µm3. The relation between lateral position, orientation of the transition moment, and transition frequency has been investigated using single-molecule fluorescence-excitation and polarization spectroscopy.
Significant observations and conclusions are:
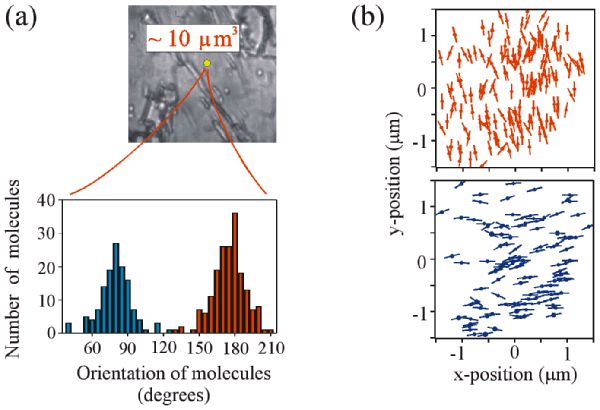
1. There is long-range ordering, albeit weak. The orientation of DBATT molecules in n-tetradecane reveals two distributions with FWHM of about 30º. The molecules of both distributions are randomly distributed inside the confocal detection volume. Down to the 100 nm scale, no subvolumes with a narrower distribution of orientations (or resonance frequencies) exist than for the bulk.

Figure 1. (a) Histogram of the orientations of 314 DBATT molecules selected within a confocal detection volume of about 10 µm3. (b) Lateral position and orientation of the DBATT molecules for the two distinct distributions in (a).
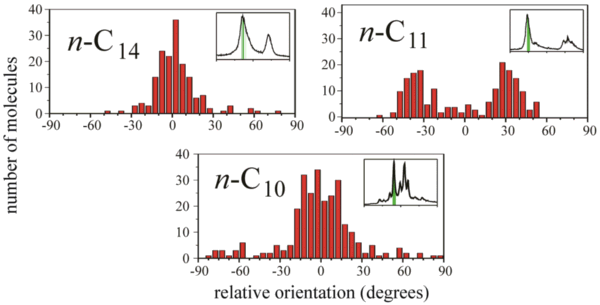
2. Orientation of guest molecule and transition frequency are not coupled, and the same holds for the width of the orientation distribution(s) and the linewidth.

Figure 2. Histogram of the orientation of single DBATT molecules in n-tetradecane, n-undecane, and n-decane.
3. With respect to the Shpol’skii effect, the absence of a one-to-one relation between a multiplet line and an incorporation is most noteworthy.


